VISUALIZING ALGORITHMS
Visualizing Algorithms is a research project exploring tactics
to engage with decision-making in simple machine learning systems. The project
studies how a decision tree classifier works allowing a user to interactively
manipulate and frame the view of a decision-making process that usually occurs
beyond human perception. By slowing down the speed of the computation to a
human-scale and allowing a user to navigate and zoom into the data that populates
the network, the algorithm’s landscape and cognition is accessible.
A decision tree is a model for predicting how data should be classified based on a previous training process. The objective of visualization techniques such as this one, provide broader access, a form of scrutiny, and process of accountability, with algorithmic decision-making. The user can identify individual data points as they flow through the algorithms network of internal paths and decisions, reverse-engineering the process.
The project primarily works with synthetic data to speculate on the concept of bias augmentation. Whilst bias in algorithms is usually attributed to the original data set, being a representation of a bias in society, bias augmentation enquires into whether a small bias in input data can be amplified through the algorithmic structure and iterative process. The project proposes that the increasingly wider adoption of autonomous decision-making system needs to be accompanied by new visual design tools for intuitive insight that do not require technical knowledge, allowing the public to hold accountable processes that might unintentionally or intentionally accentuate bias.
Research questions:
- can the visualization of algorithms be used as an a-linguistic tool to re-engage with decision-making in prediction systems, where we are at risk of losing our connection of decision-making?
- can interaction design, generative design, and critical code studies, combine as an effective method to visualize ethical positions in algorithms, including bias, mistakes, and interpretability?
- to consider bias augmentation, what can be learnt by temporarily isolating the meaning in data, to focus on the effect that structure and process play in the generation of bias?
- what does it mean to learn, in artificial intelligence systems, and is the anthropomorphic analogy productive?
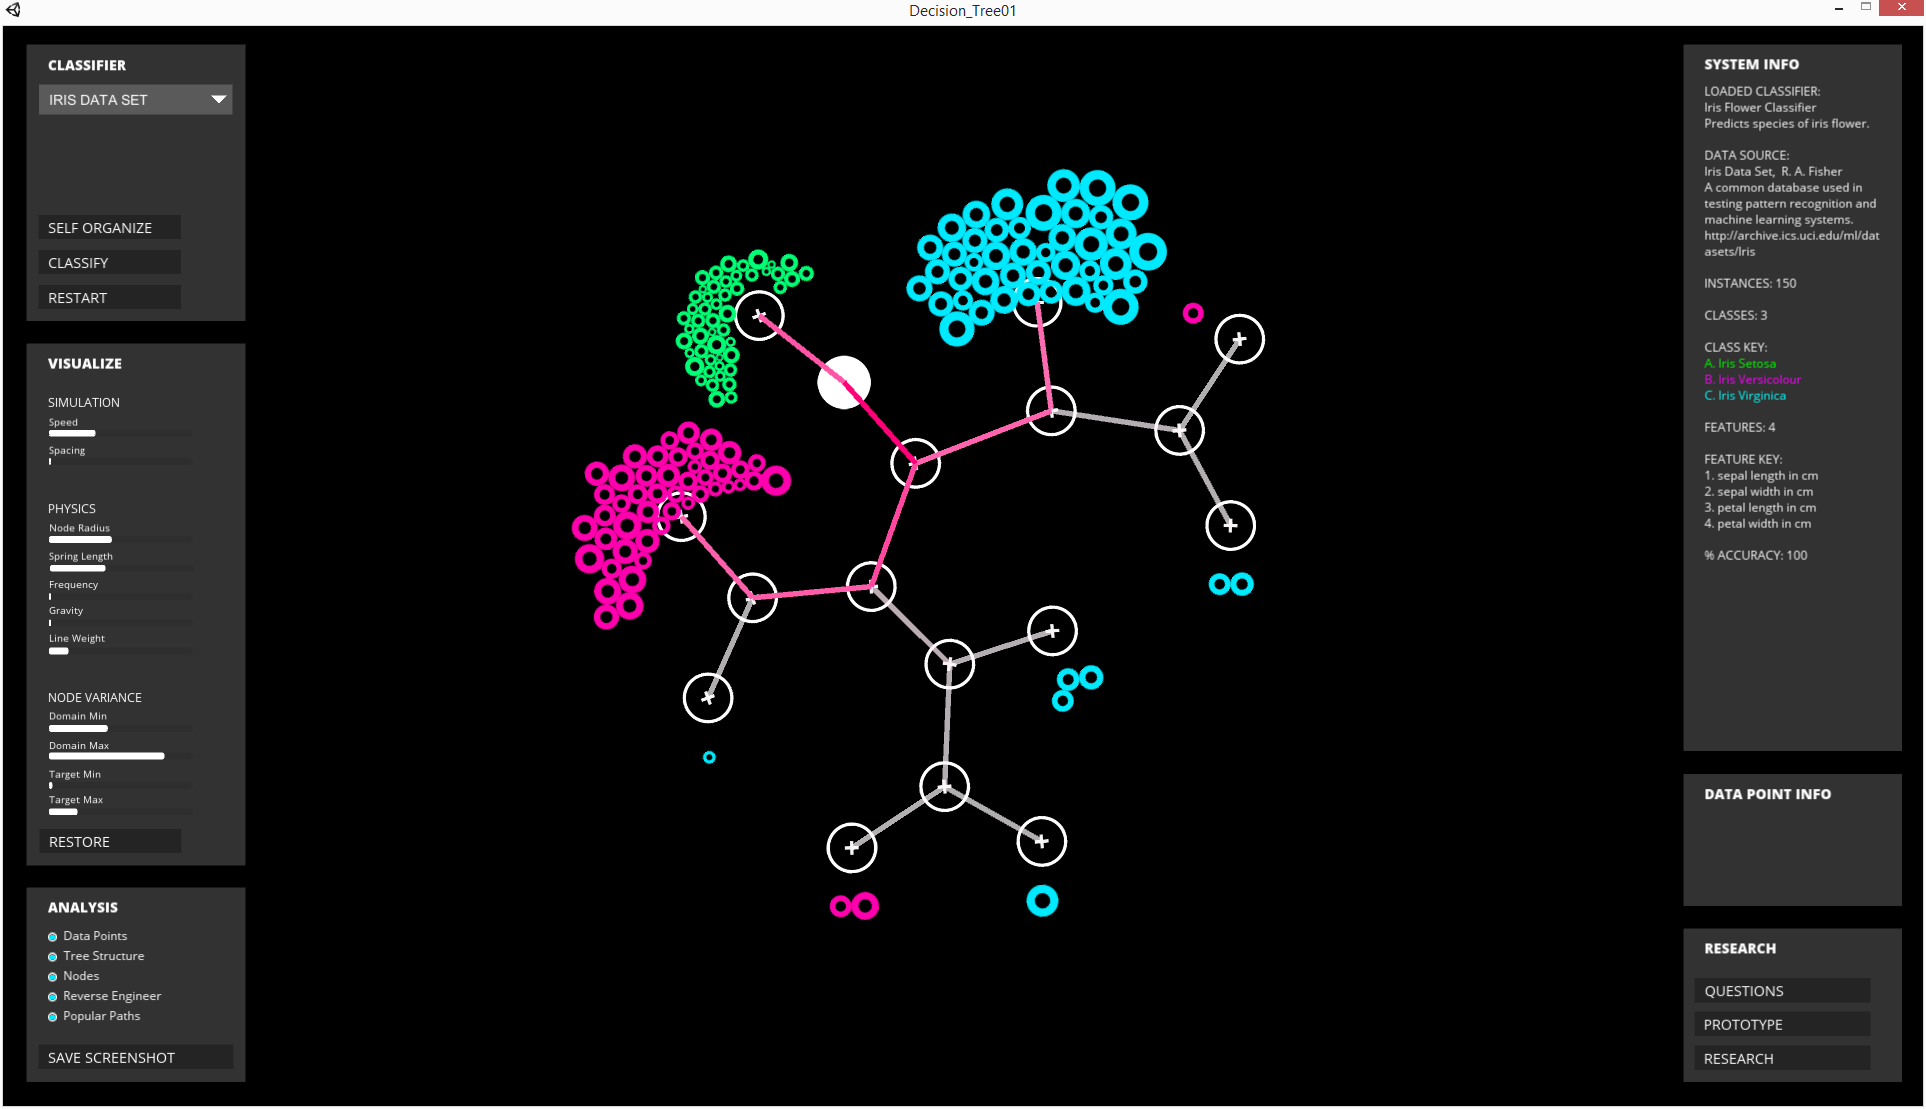
Basic visualization of decision tree structure and classified data in interactive application.
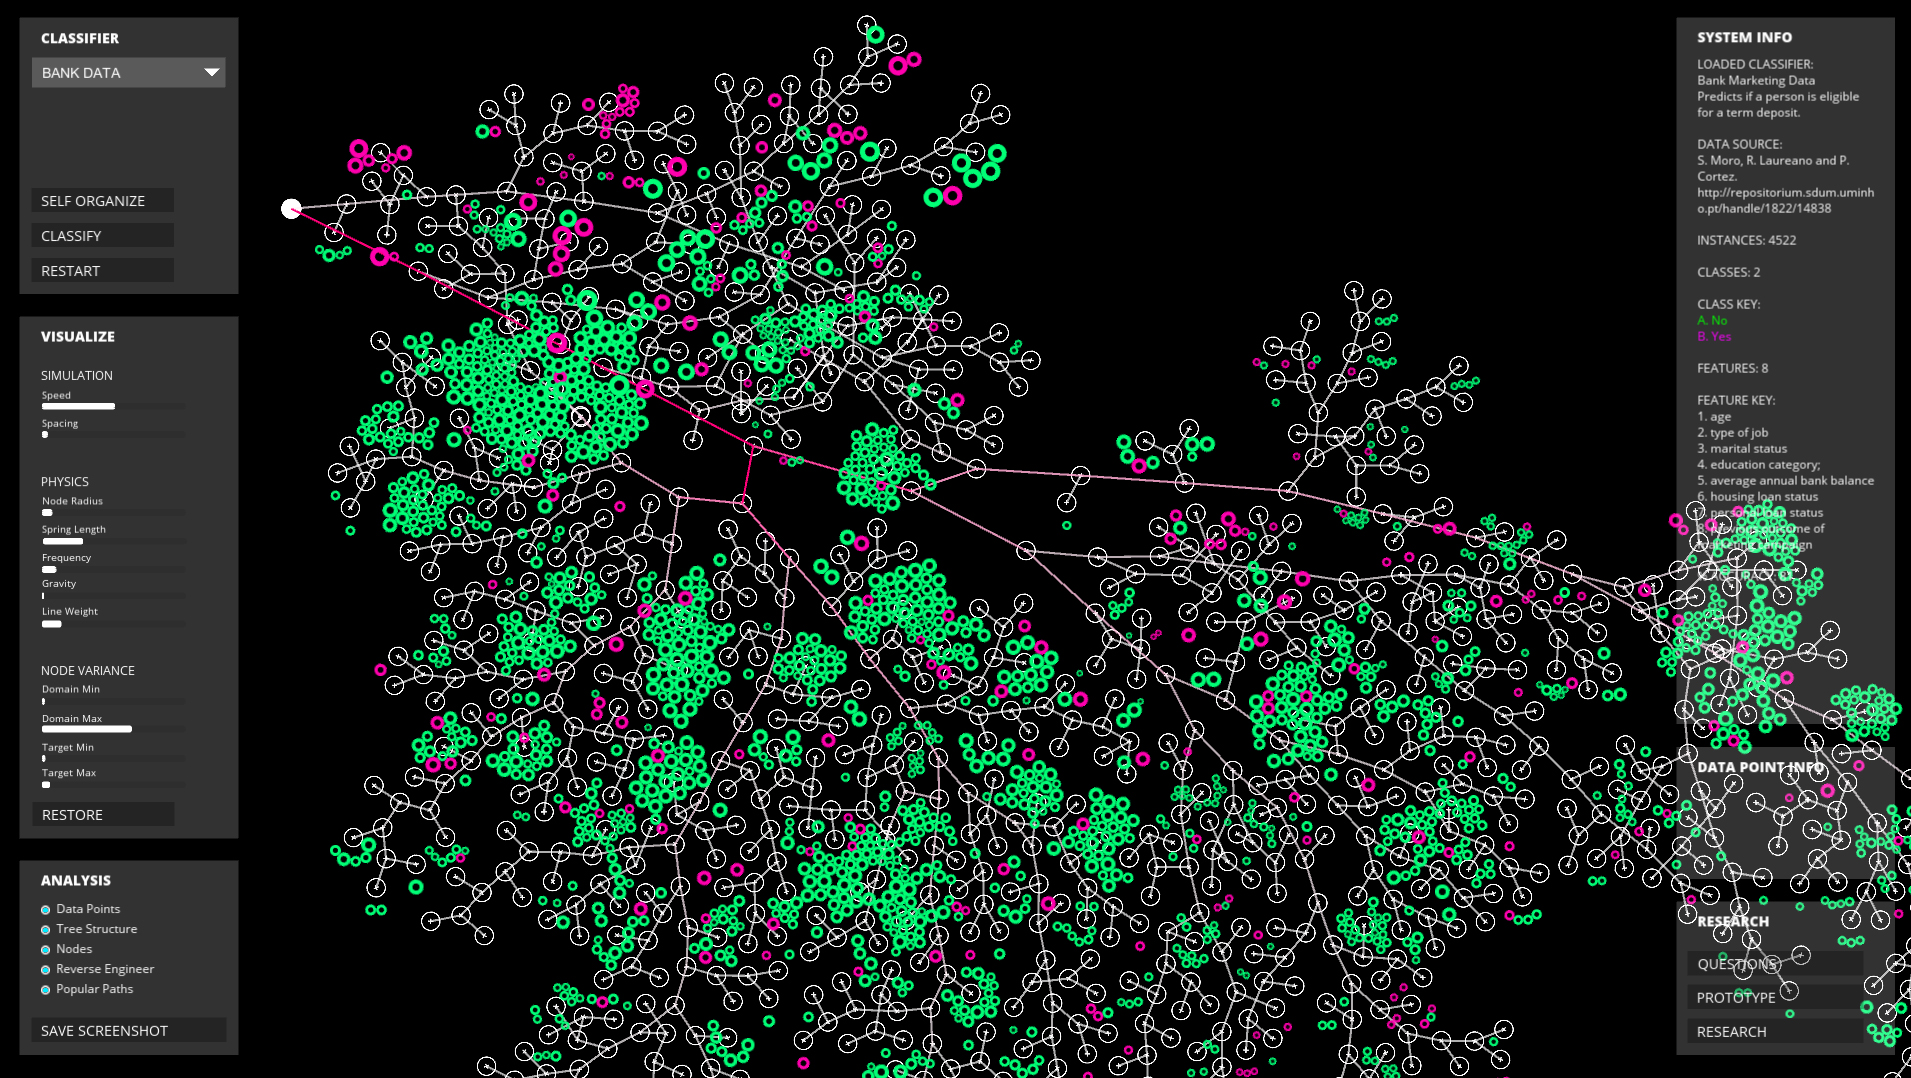
Large decision tree using synthetic data.
Mistakes in classification are highlighted.
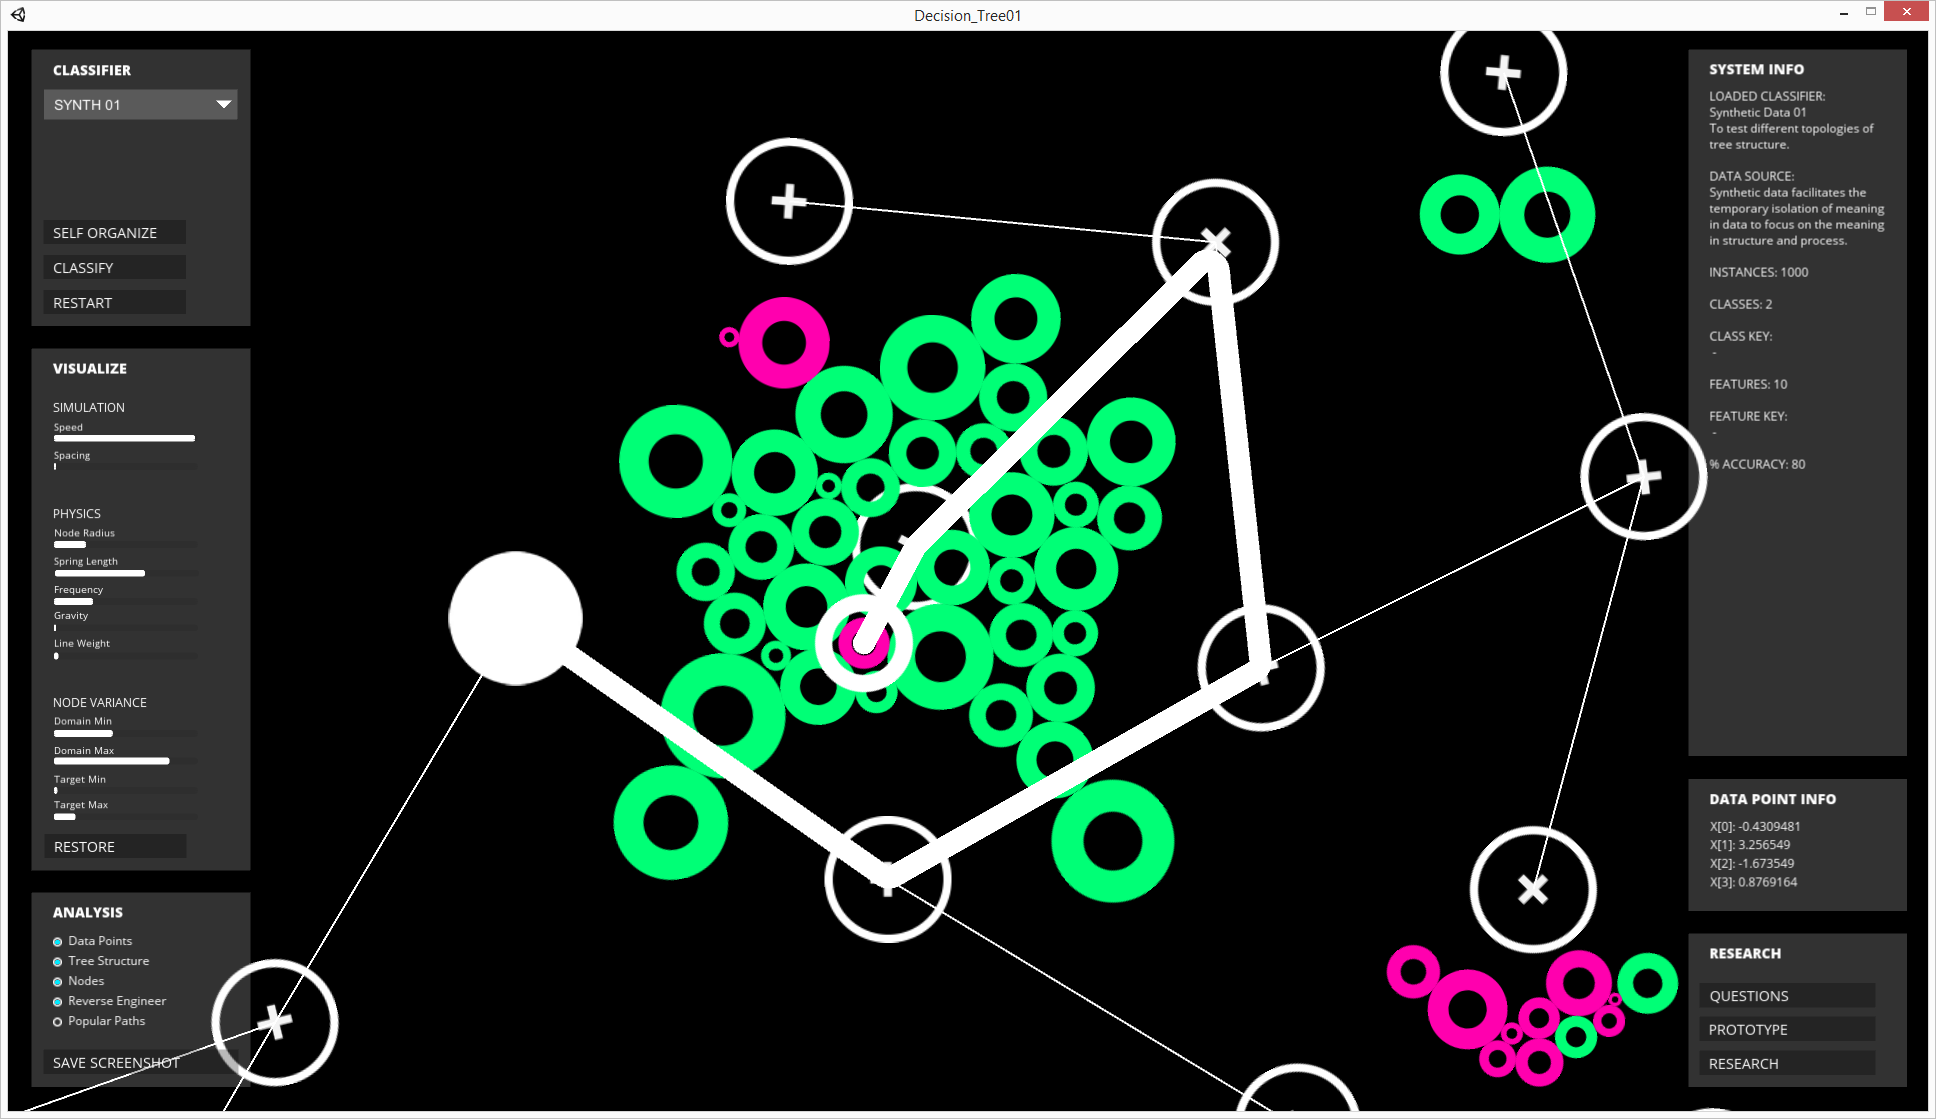
User can zoom in on indivual data points and view their reverse-engineered pathways.
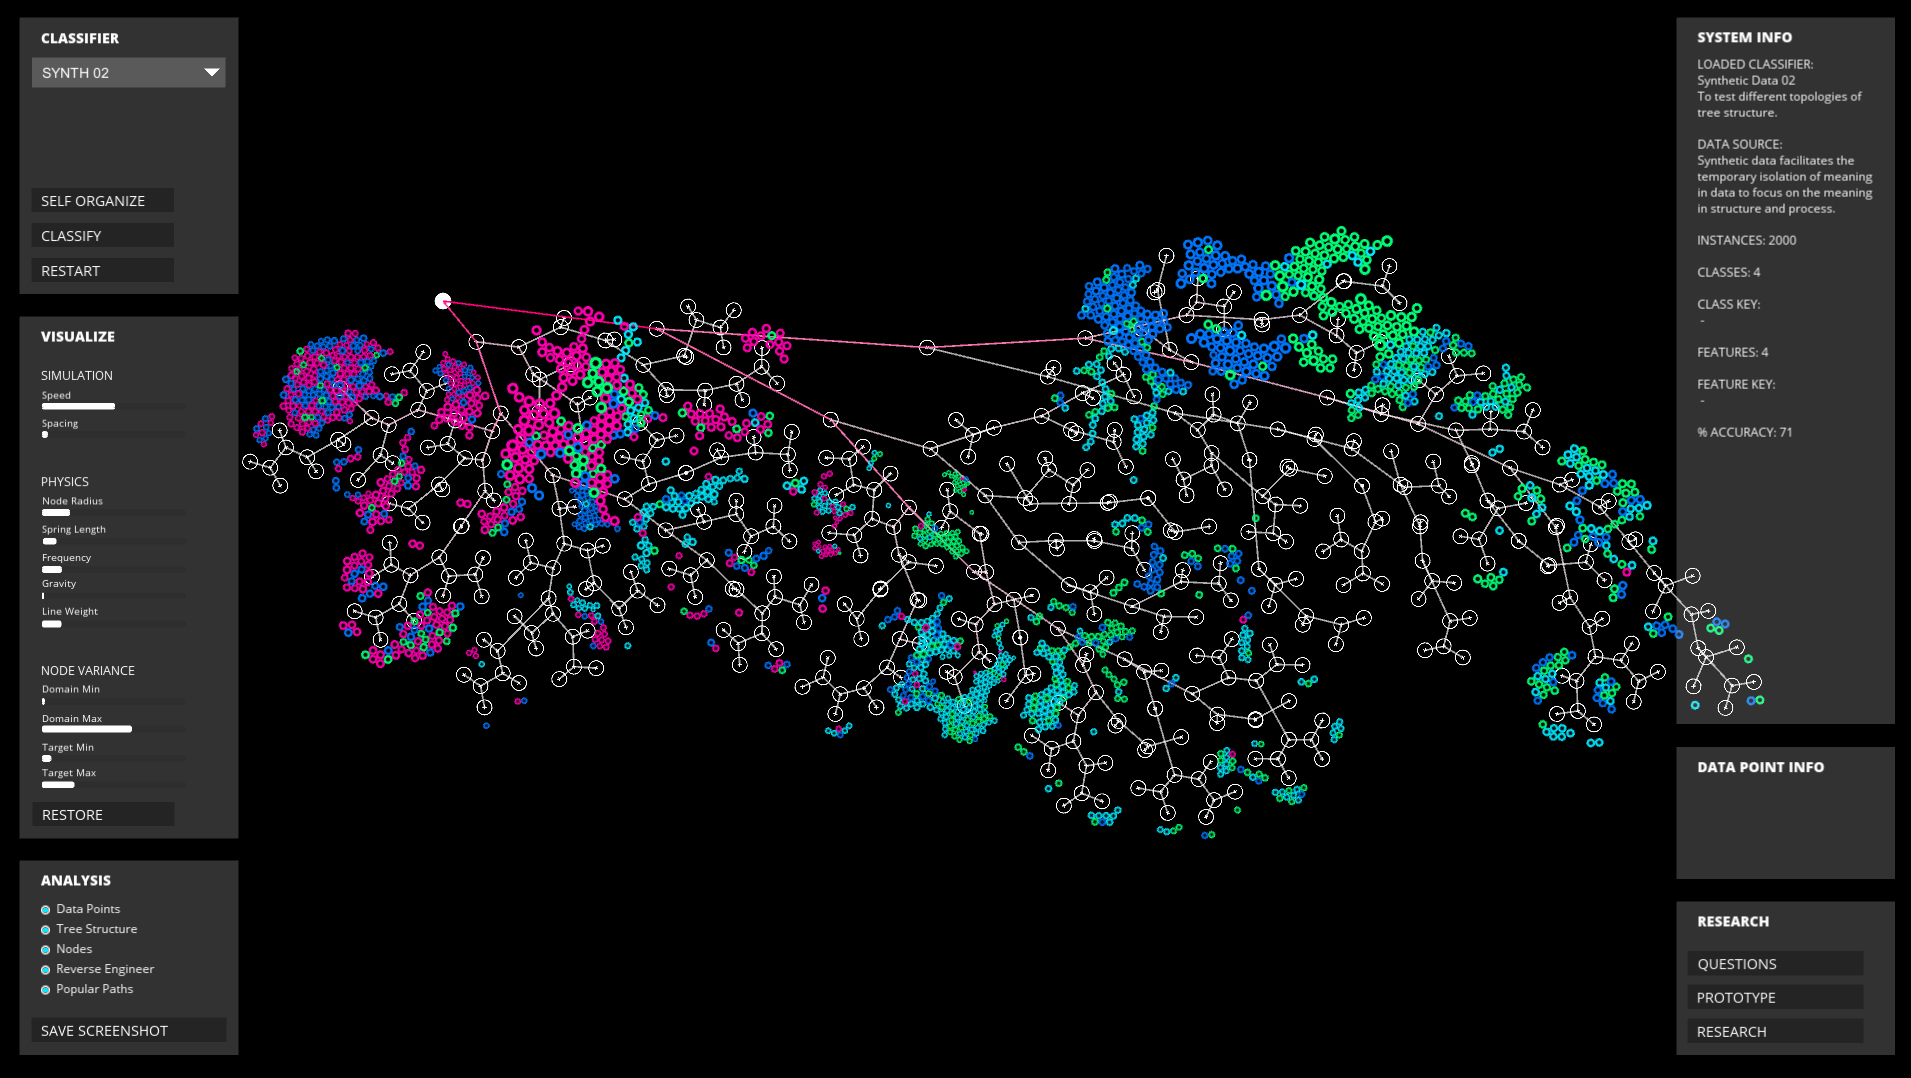
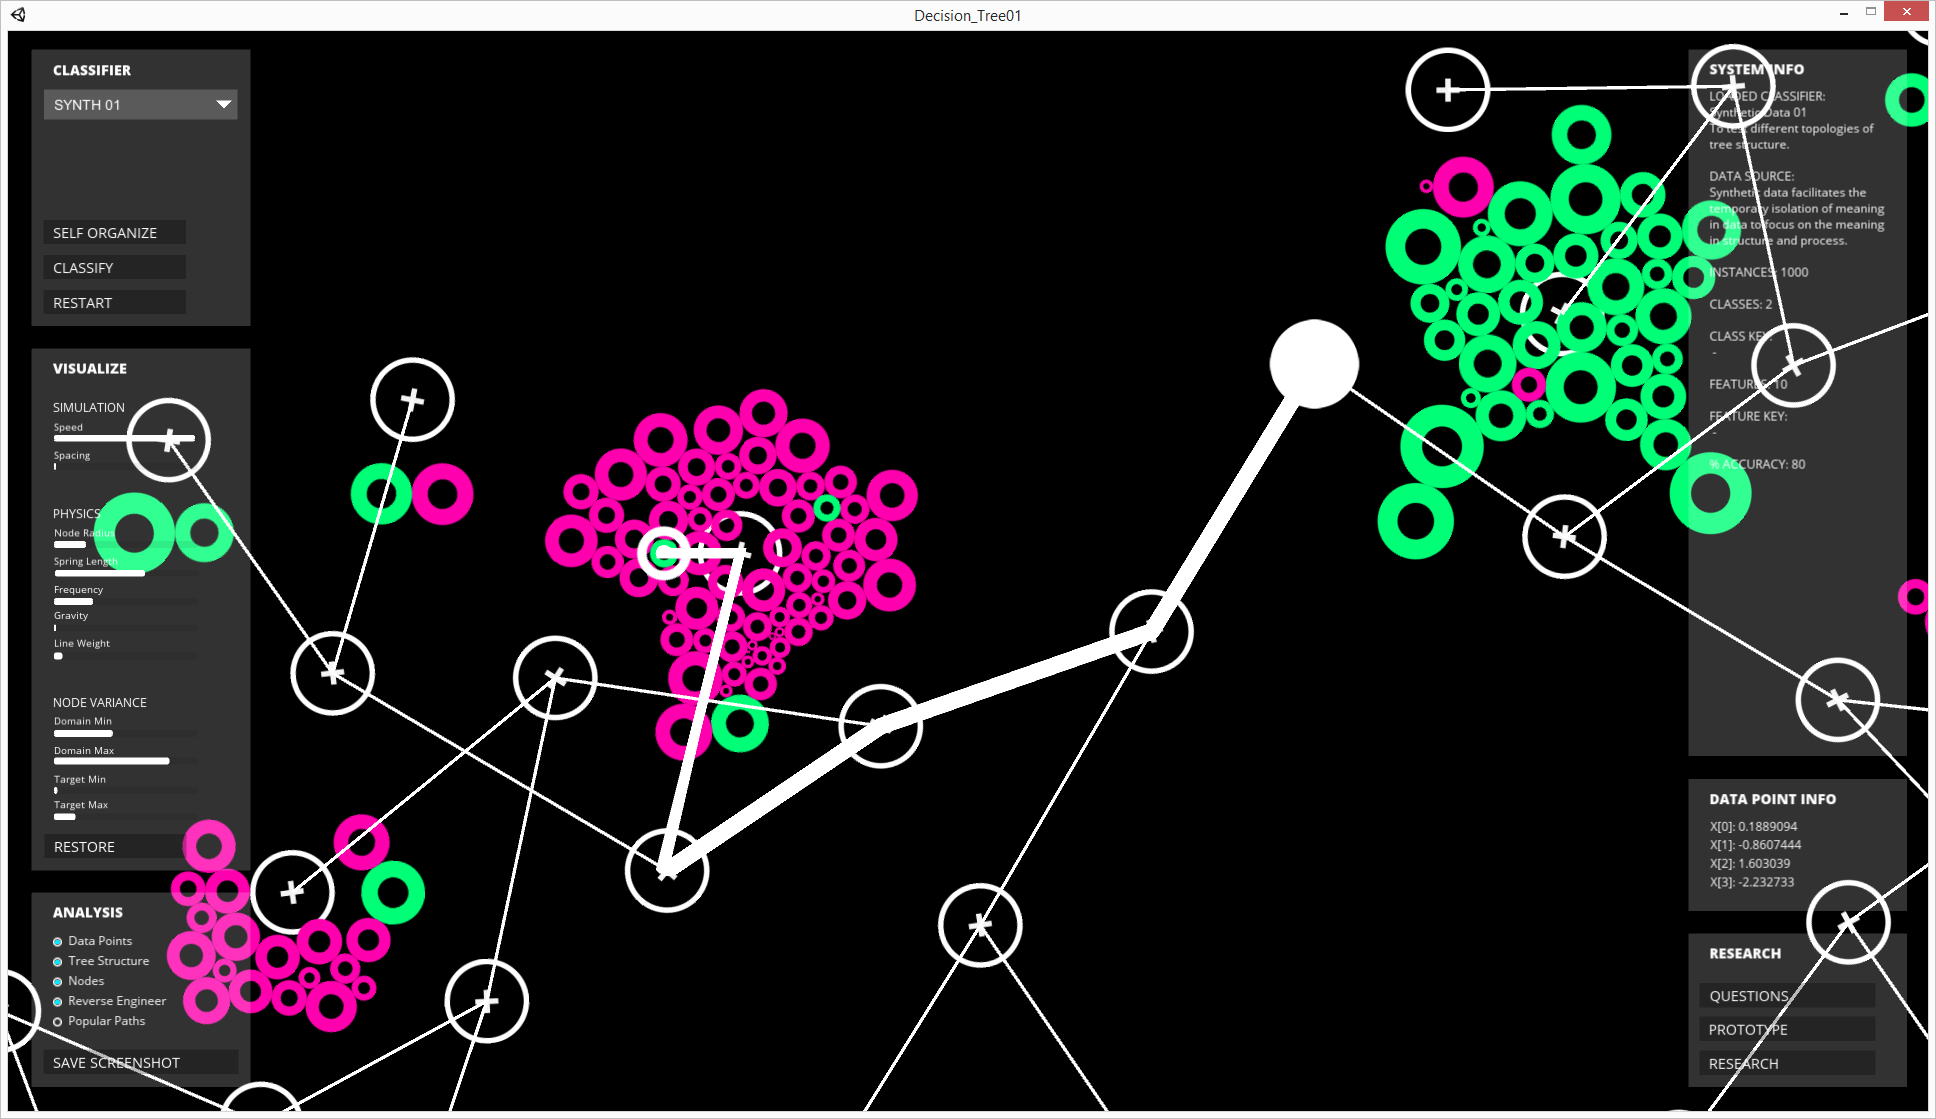
The application maps out the algorithm spatially, to see its full possibility space.
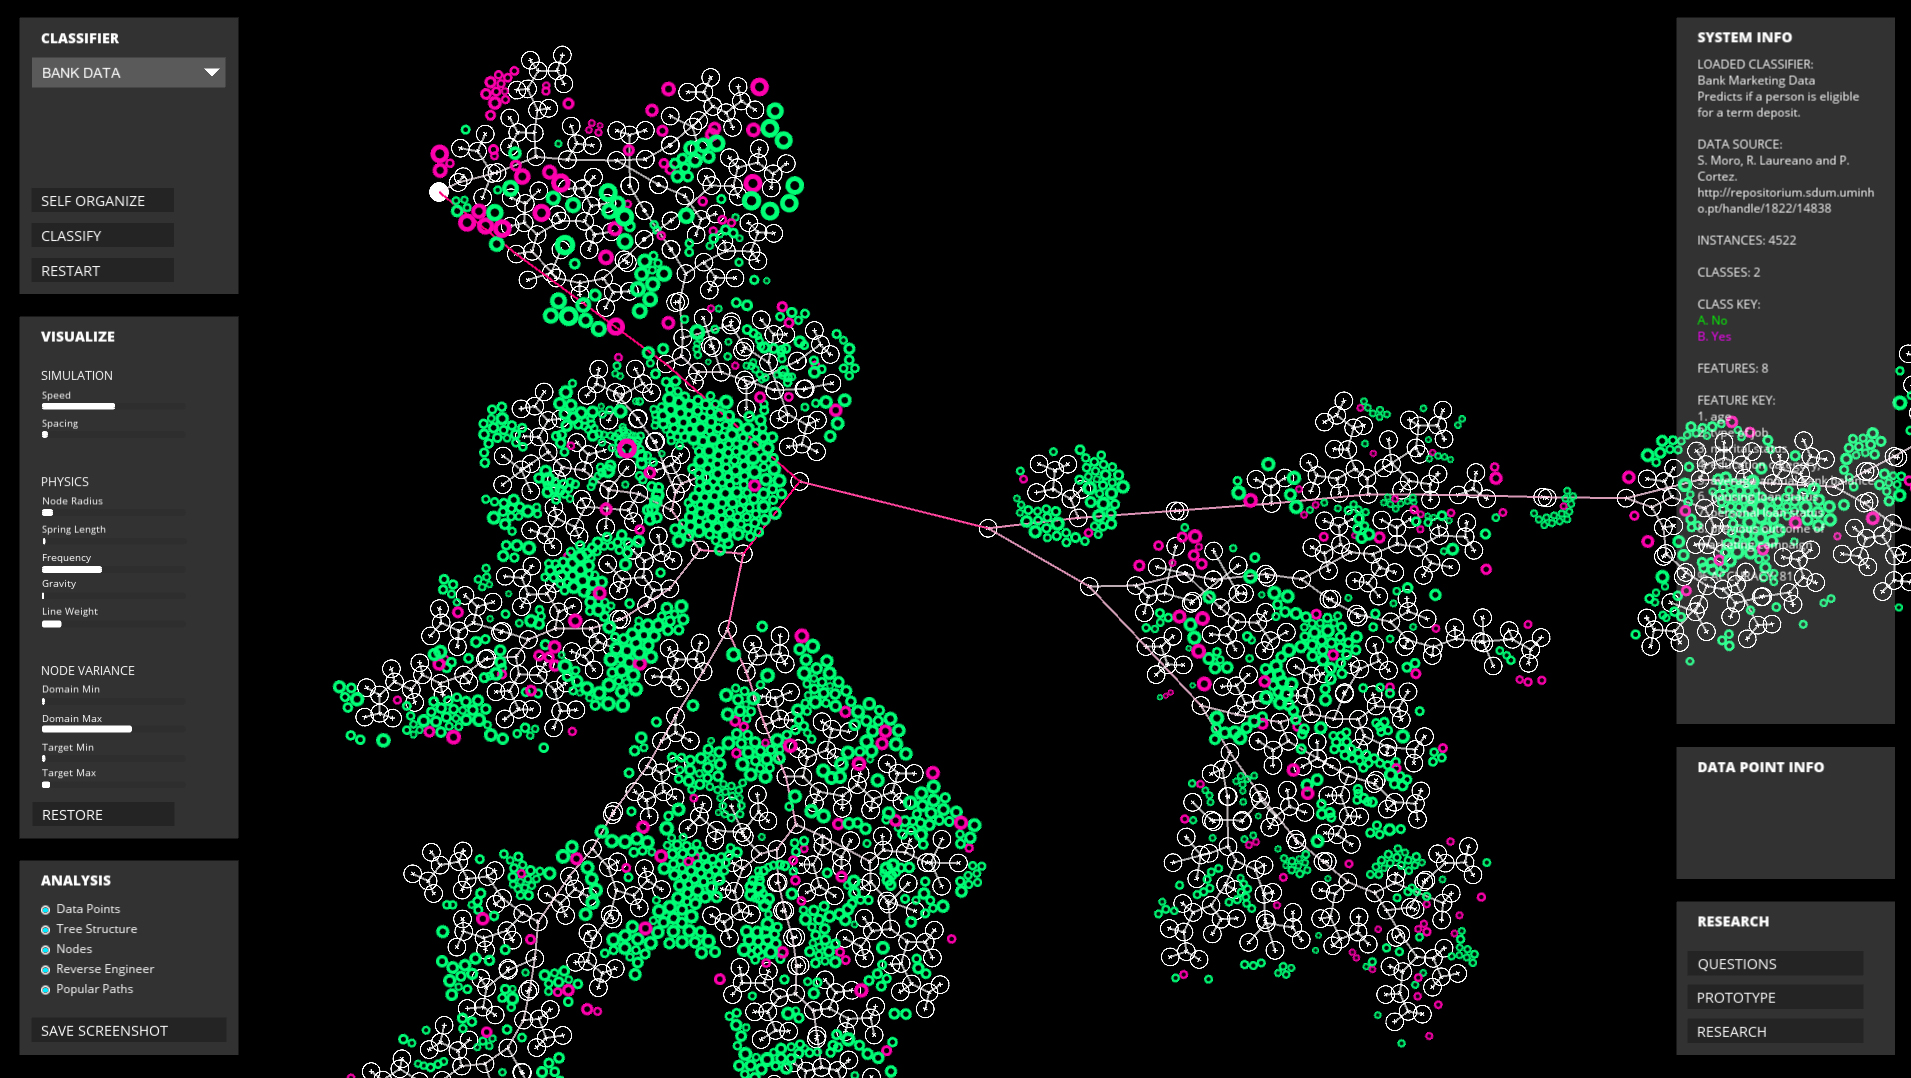
Large decision tree of synthetic data. The overall data organization is a combination of a
physics simulation, self-organizing tree structure, and user-defined parameters.