LA RIVER
This visualization analyzes nutrient levels in the Los Angeles River. It aims to provide an
overview of the available public data; it’s geographic, seasonal and annual scope, and also its
limitations. It also presents a case for greater community engagement with water testing to
inform and encourage leadership in the restoration of the LA River.
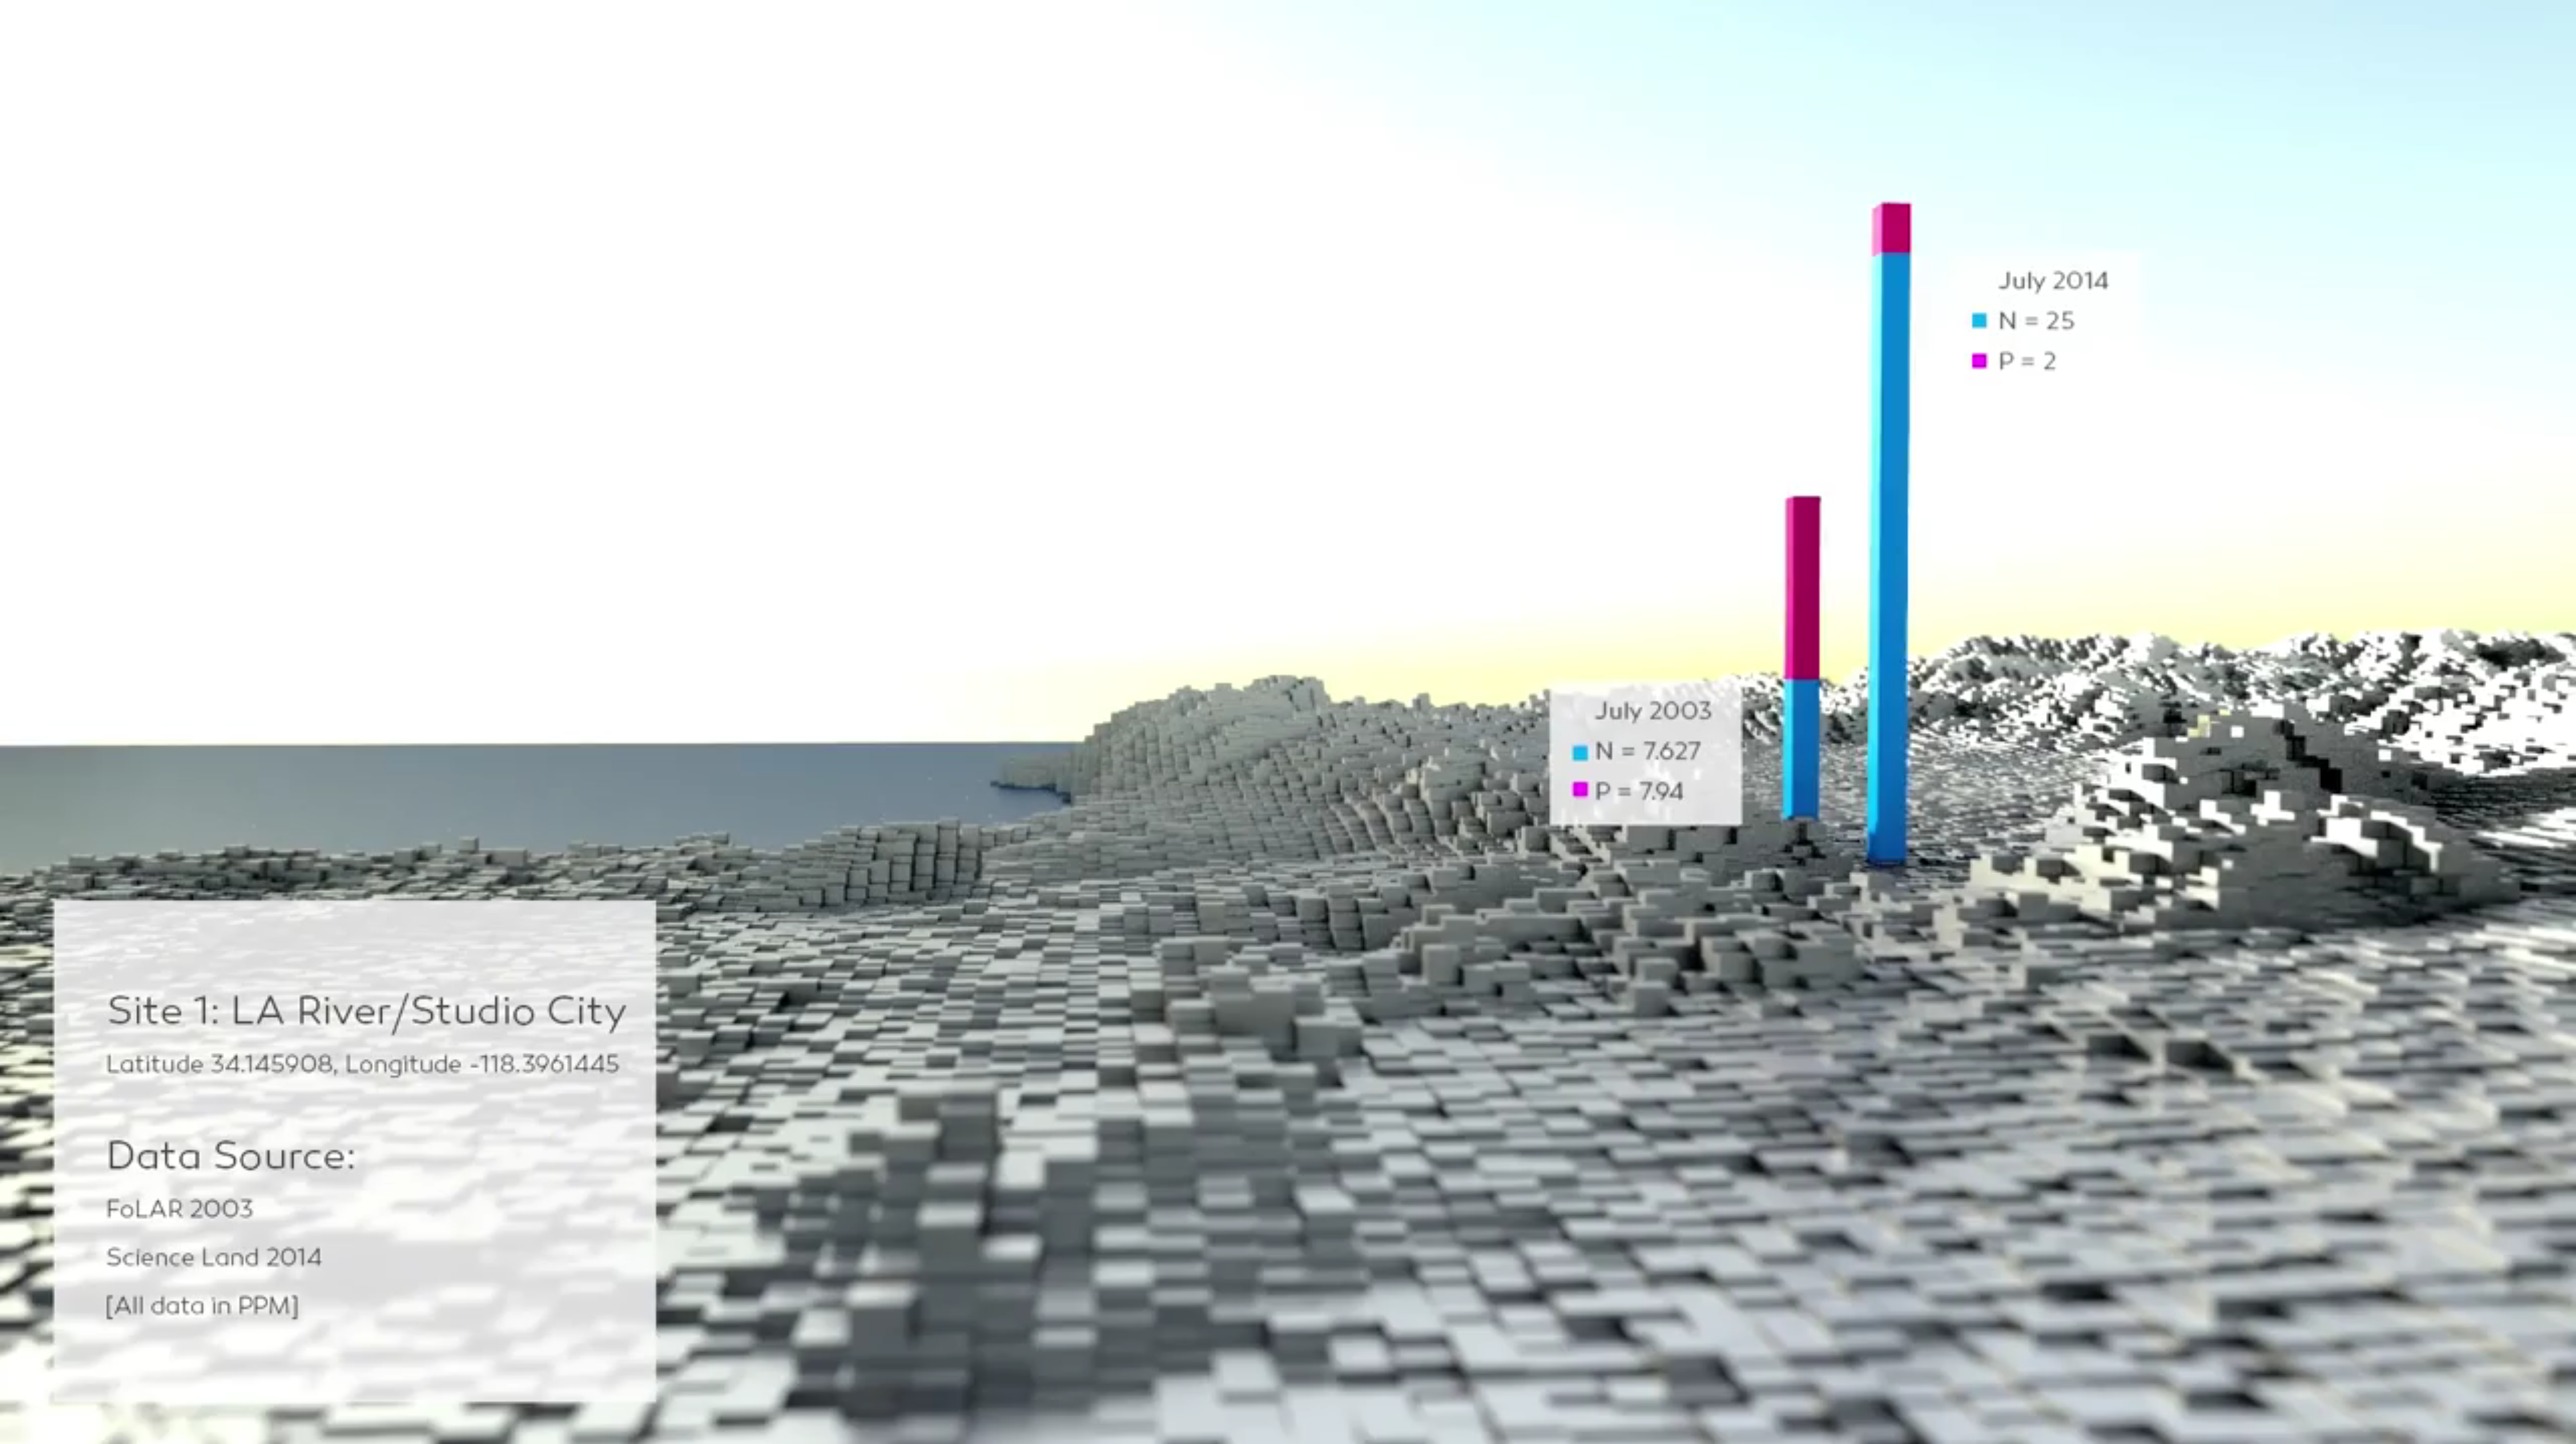
A digital elevation model of the LA River watershed is used to create a geo-referenced 3D
terrain model, that can be cross-referenced with any GPS associated database, to allocate
data spatially. Total nitrogen and phosphorus data are visualized spatially and animated over
time, within the same geo-referenced 3D world. Working with a high resolution rendering
workflow, which incorporates smooth camera tracking, ambient lighting, material textures, and
accentuated depth of field, the visualization is designed to achieve a filmic look, in order to
engage a wider audience with the data narrative.
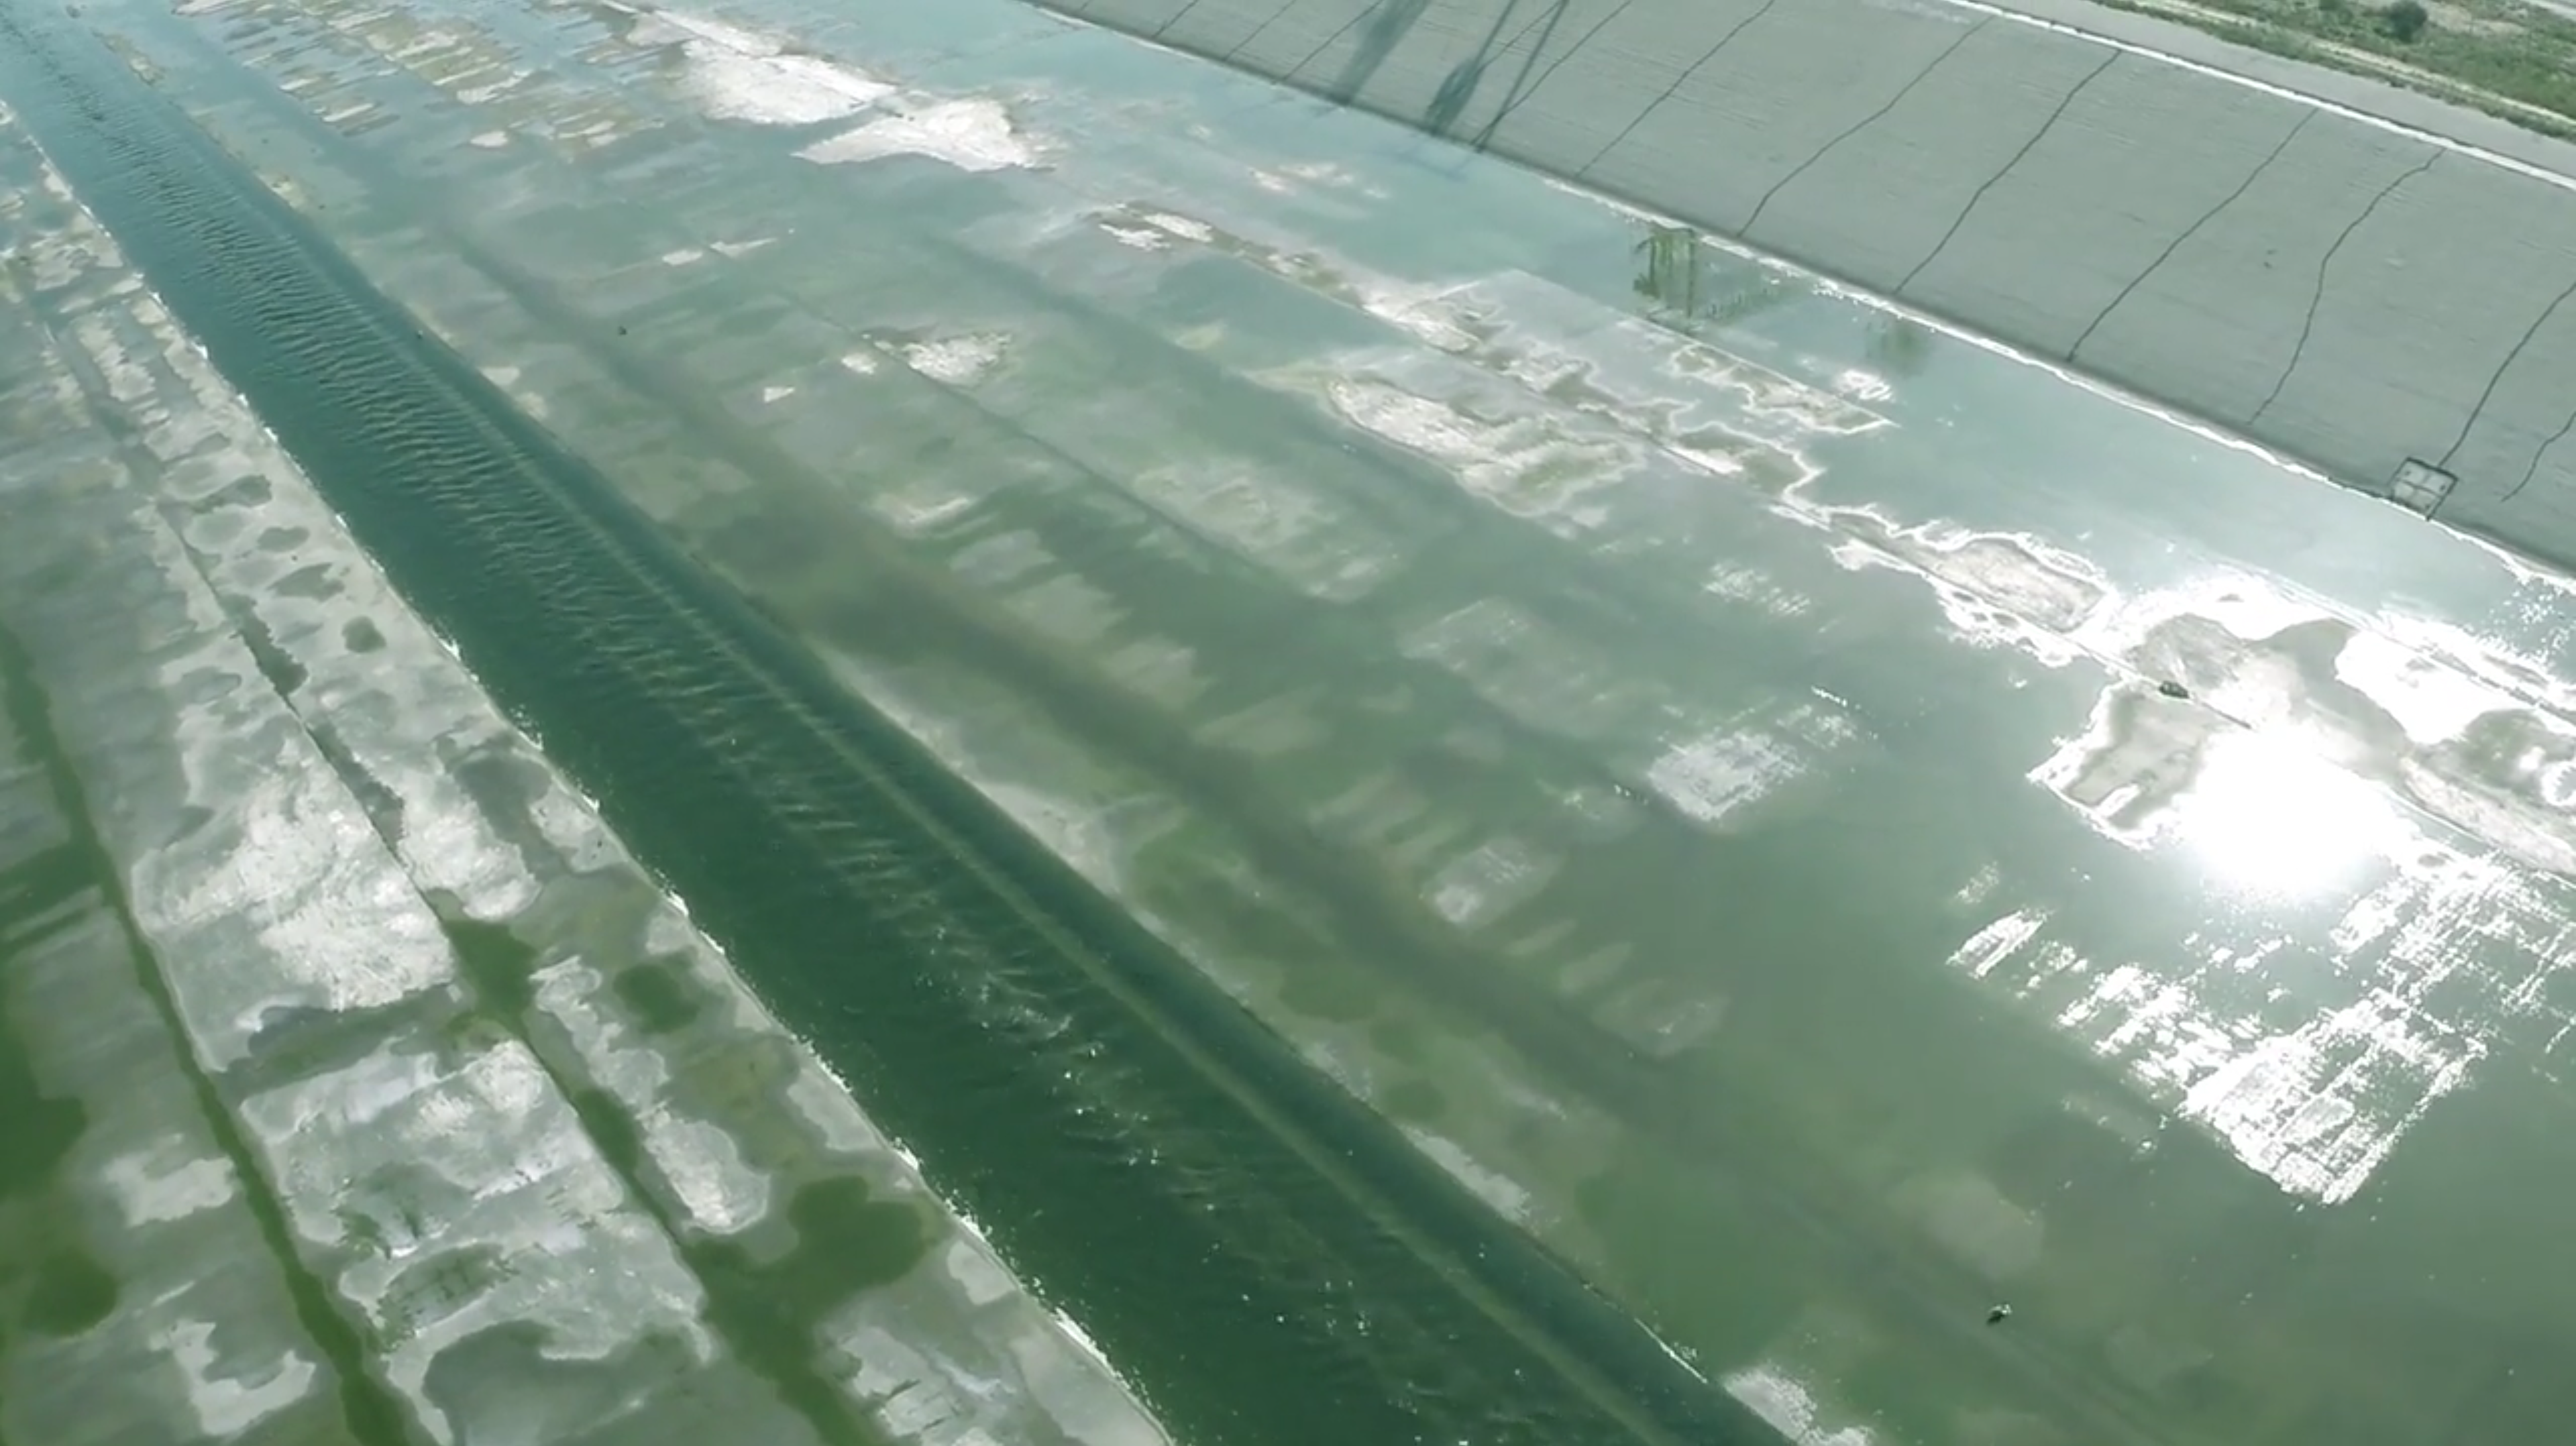
The work is complemented by aerial footage from a quad-copter to provide a local geographic
reference point to the abstracted data, also giving the data a sense of scale and inviting the
audience to consider each data site in relation to its local neighborhood.

The LA River is a site of important current public and government discourse. It sits on the
cusp of a landmark $1 billion redevelopment to restore what has been a fully encased
concrete flood control channel, back into a natural river ecosystem with vegetation, wildlife
habitat, riverside parks, recreational activities and public access.
The LA River was largely a forgotten space, cut off from the urban fabric of the city and its
citizens. However a future is now being planned for the LA River that will see it become a
waterway of national significance.
After analyzing all surface water data sets available on the LA River from the Water Quality
Portal, nitrogen and phosphorus results provide at best an inconsistent picture of nutrient
levels in the river. Two other publically available data sets were analyzed to provide further
detail and to offer a comparison.
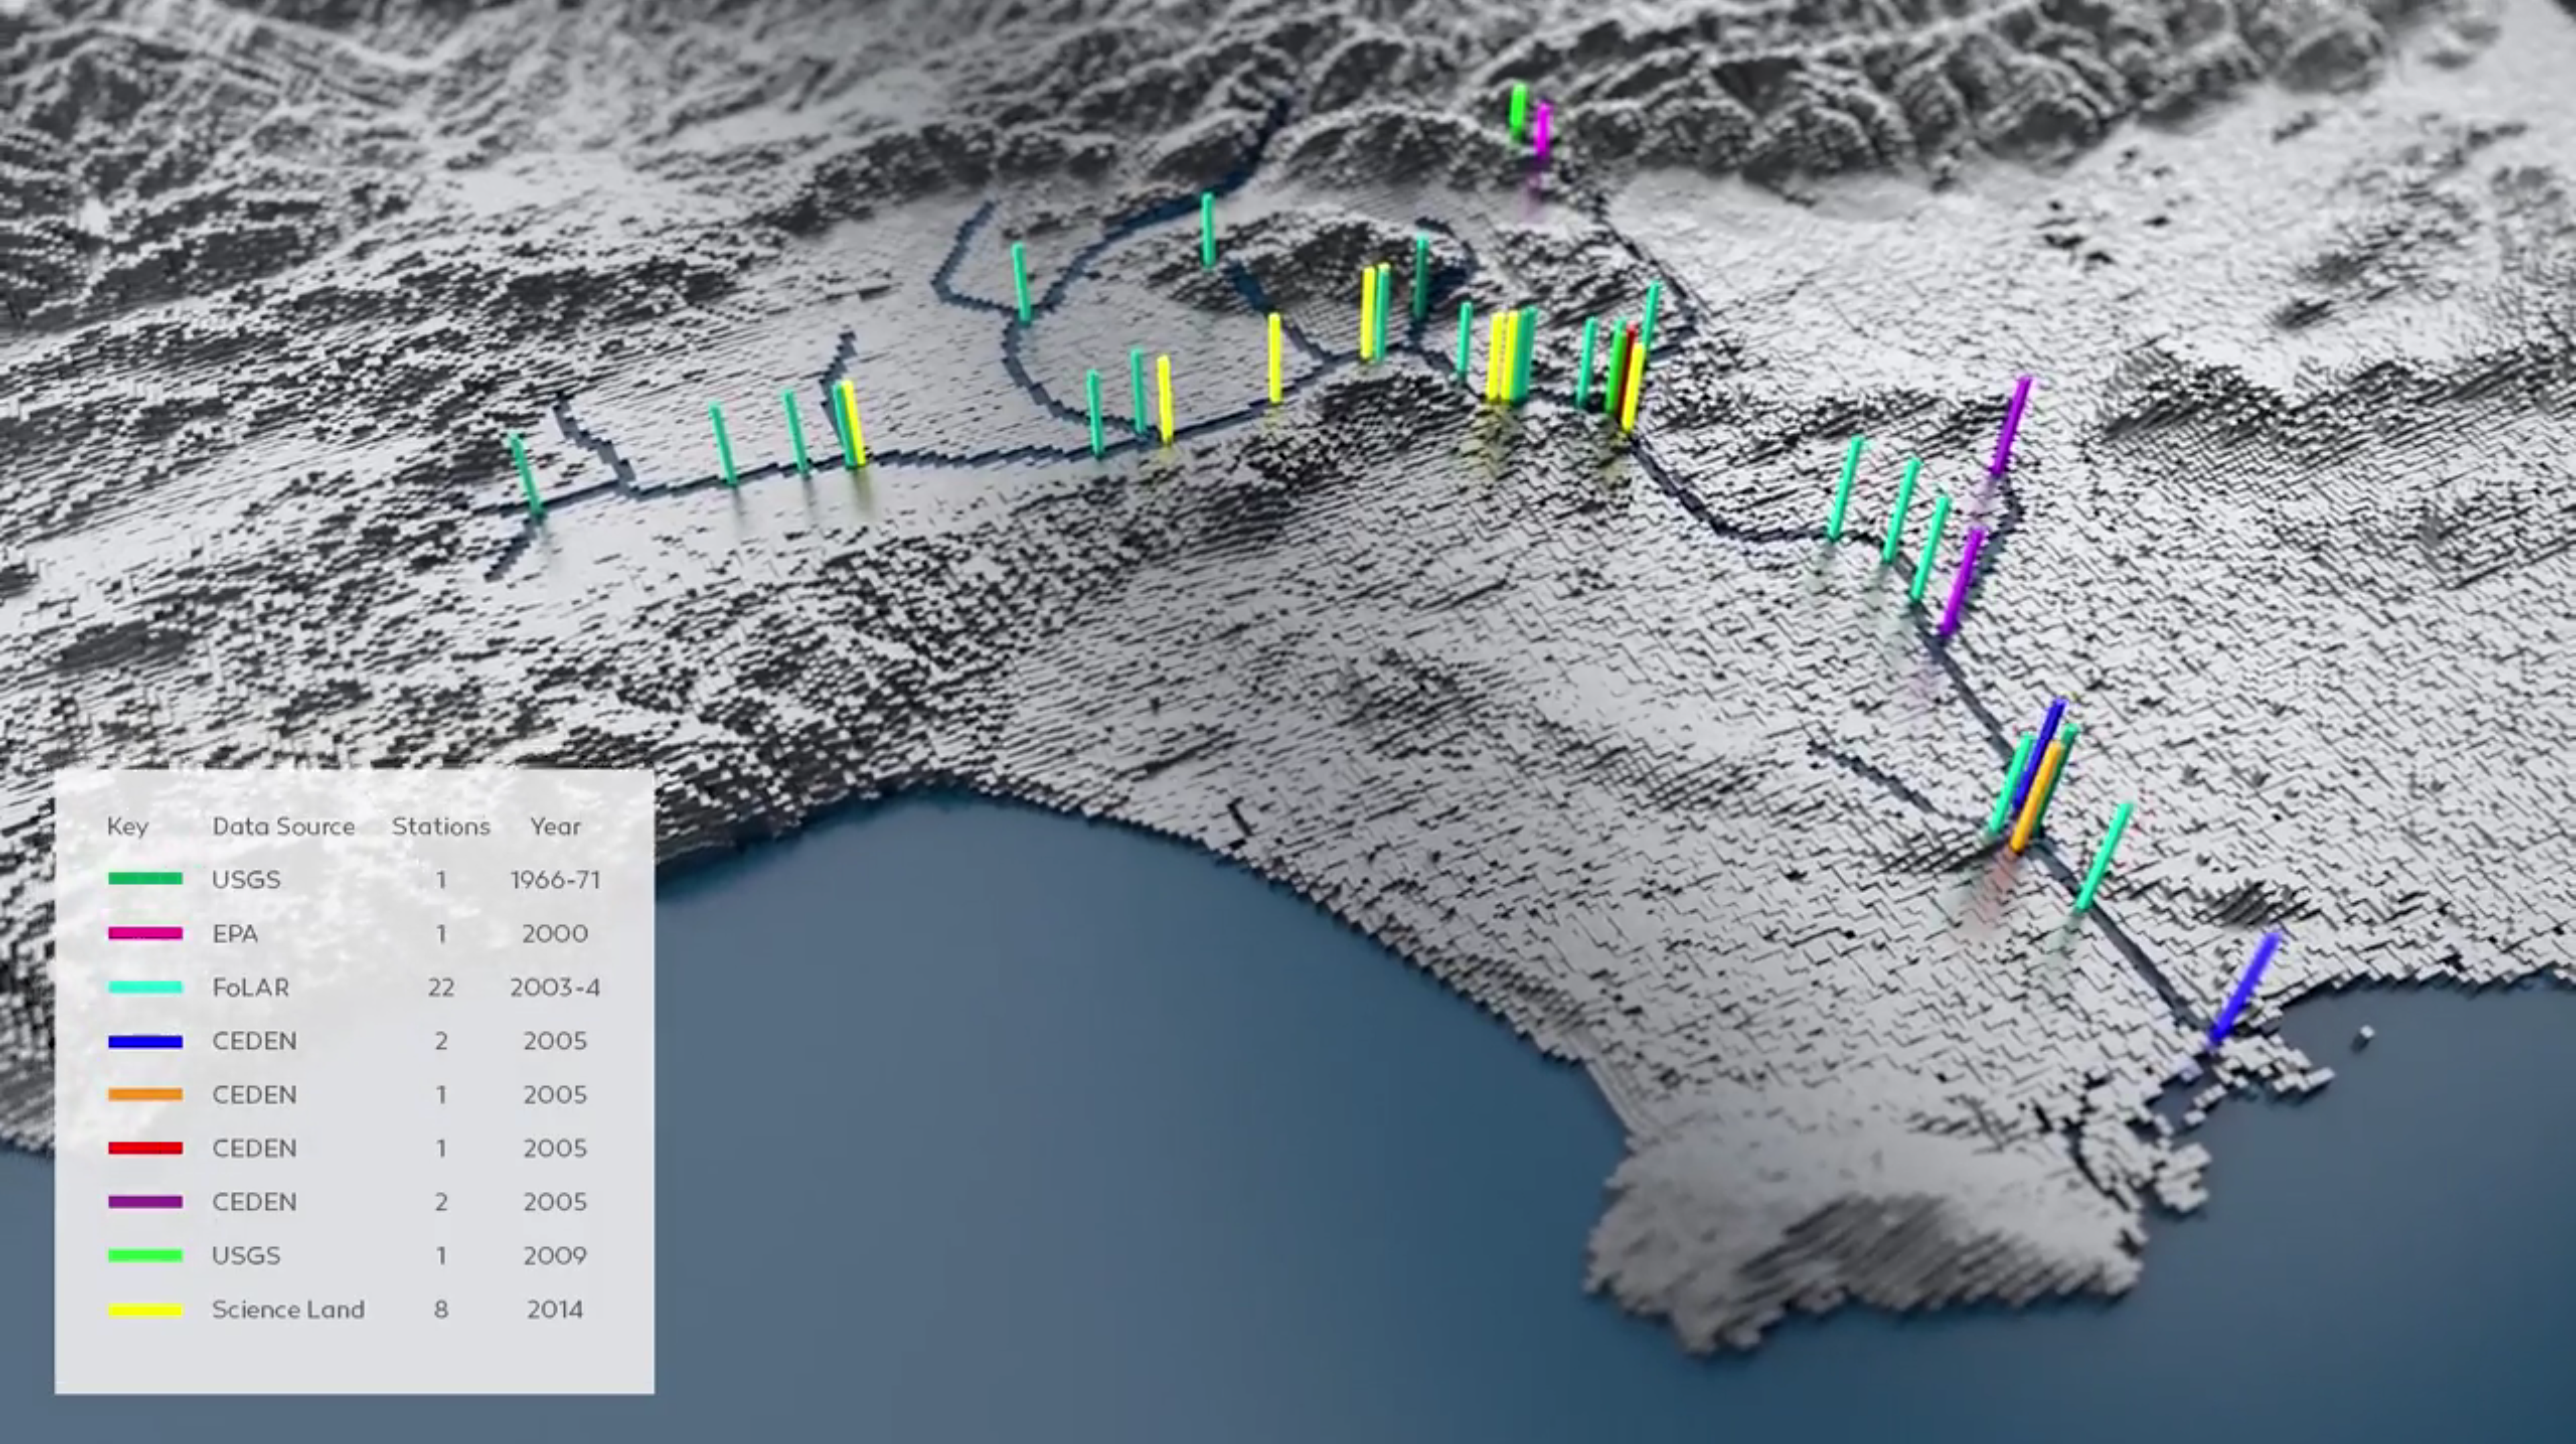
The Water Quality Portal provided surface water quality data from nine monitoring stations.
Additionally, data from another 22 monitoring stations was obtained from Friends of the Los
Angeles River’s, River Watch study, and data from a further 8 monitoring stations was
obtained from Science Land’s E-CLAW project. The data ranges from 1966 to 2014.
From a total of 39 monitoring stations, which range from the source of the LA River to it’s
mouth, including several tributaries, the data was analyzed geographically, annually,
seasonally, and by station over time. Observations show that there are consistently higher
concentrations of nutrients over a 24-mile stretch between the Sepulveda Basin and
Downtown LA, whilst the river south of Downtown to the estuary and all the tributaries show
consistently lower nutrient levels. There is a 6 miles stretch of the river that has a partly
natural riverbed, and dense vegetation, however this does not specifically affect nutrient
levels. Other data available that records bacteria, metals, dissolved oxygen and debris,
demonstrate high levels of pollution more clearly than nitrogen and phosphorus alone,
however that data has not been used in this visualization.
The First State of the River Report, 2005, published by Friends of the Los Angeles River,
summarizes that based on one year’s worth of monitoring at 22 sites, the river fails to meet
Water Quality Objectives and bacteria counts consistently exceeded Health Department
standards.

The most comprehensive recent studies of the LA River water chemistry were organized by
two community groups, in conjunction with trained scientists and recognized laboratories, and
this project proposes that such community-led testing could provide a greater role alongside
government testing in the future. Community-led water testing of the LA River empowers
communities to take charge of their local environments, understand when changes occur and
take greater action.
Today, pollution of the LA River is primarily caused by non-point source pollution, a problem
that can be remediated through the actions of local communities. It is only through greater
awareness, specifically data-driven awareness that communities can organize themselves to
change behaviors, promote more knowledgeable practices, and campaign for change. Citizen
science, in conjunction with government scientific data collection can connect communities
with their environments in a more intimate and intelligent way.